Multi-Parabolic Reflector Lighting System
1. Main Content
The reflectors in this design are all made using parabolas, with the parabolic equation
y 2 =4fx
. A parabola is the locus of points in a plane that are equidistant from a fixed point (called the focus) and a fixed line (called the directrix) that does not pass through the focus. As shown in Figure 1 (Parabola Structure Diagram), there is a fixed line L (purple) and a fixed point F not on the line; the set of all moving points P in the plane where the distance to line L equals the distance to focus F forms a parabola. Line L (purple) is the directrix, and point F is the focus. The line M (red) passing through the focus and perpendicular to the directrix is called the axis of symmetry (referred to as the axis). The intersection point V of the axis and the parabola is the vertex. The distance from V to F is the focal length. A line segment connecting two points on the parabola is a chord; a chord passing through the focus is a focal chord. The focal chord P1P2 (blue dashed line) perpendicular to the axis of symmetry is called the latus rectum.
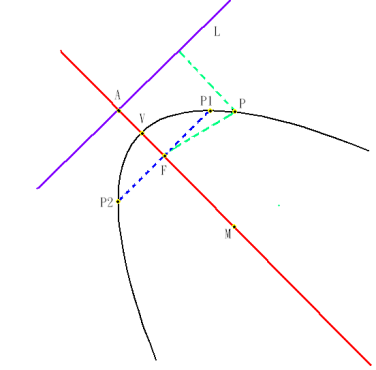
Figure 1. Parabola Structure Diagram
This design uses a parabola as the reflecting surface because light emitted from the focus, when reflected by the parabolic reflector, will exit parallel to the main axis. After creating the module using the modeling software SolidWorks, the module was imported into the optical simulation software FRED. Each of the three parabolic reflectors in the module has a 22.5-degree angle, with a total light outlet size of 27.661mm and a length of 13.836mm. An LED light source was then placed at the focal point (0,0,0) of the lens, and a 5.503mm lens was positioned at the focal length X=7.739, as shown in Figure 2 (Module Schematic). A 28mm analysis surface was then set 50mm in front of the LED at X=50mm.
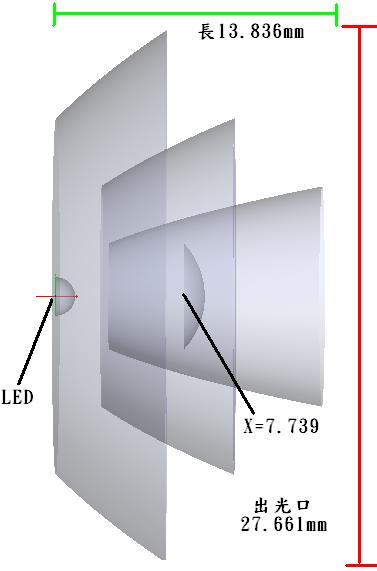
Figure 2. Module Schematic
As shown in Figure 3, ray tracing was performed using 100 rays. It can be observed that rays with a 90-degree divergence angle, after passing through the three parabolic reflectors, exit parallel to the axis, while the central rays that do not pass through the parabolic reflectors exit parallel through the lens.
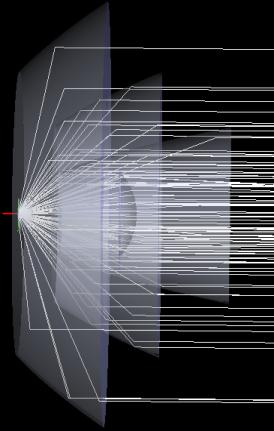
Figure 3. Ray Tracing Diagram (100 Rays)
Figure 4 (Illuminance Diagram) shows the simulation results using 50,000 rays. The illuminance diagram reveals that high-intensity light (represented in red) is concentrated in the center of the analysis surface, with an intensity range of 0.0136~0.0153W/mm². The intensity decreases in the order of orange (0.0119~0.0136W/mm²), yellow (0.0102~0.0119W/mm²), green (0.0051~0.0102W/mm²), and light blue (0.0017~0.0051W/mm²), forming a circular pattern. The outermost dark blue (0~0.0017W/mm²) indicates the weakest illuminance.
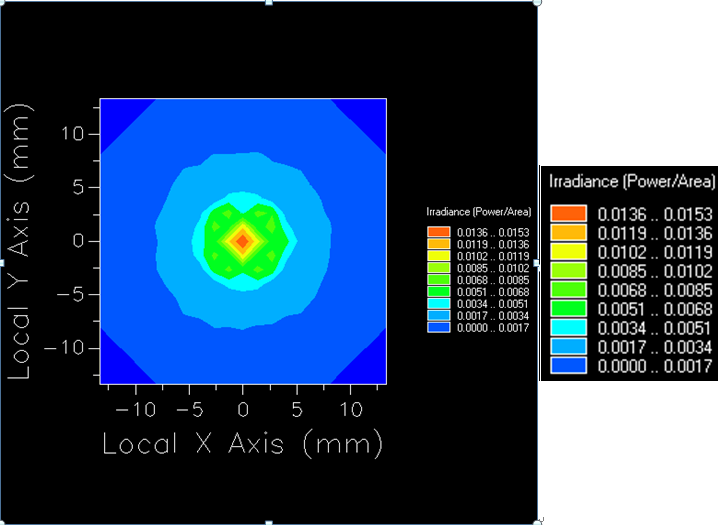
Figure 4. Illuminance Diagram
Figure 5 (Light Spot Diagram) clearly shows the light pattern formed by the three parabolic reflectors.
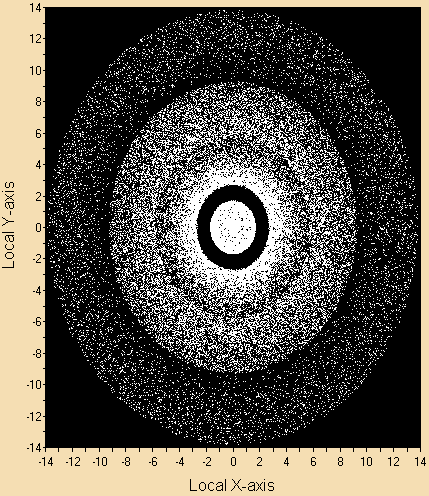
Figure 5. Light Spot Diagram
A traditional TIR lens module was also fabricated. TIR lenses are made using parabolic reflectors and lenses; Figure 6 (TIR Lens Principle Diagram) illustrates how naturally divergent light is collimated by the parabolic reflector and exits parallel.
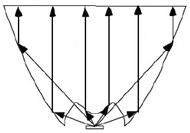
Figure 6. TIR Lens Principle Diagram [4]
The TIR lens module was created using SolidWorks and imported into the optical simulation software. The reflector was also made of a parabolic surface, with a light outlet size of 27.661mm and a length of 33.468mm. The lens, LED, and analysis surface had the same sizes and positions as in the multi-parabolic reflector module, as shown in Figure 7 (TIR Module Diagram).
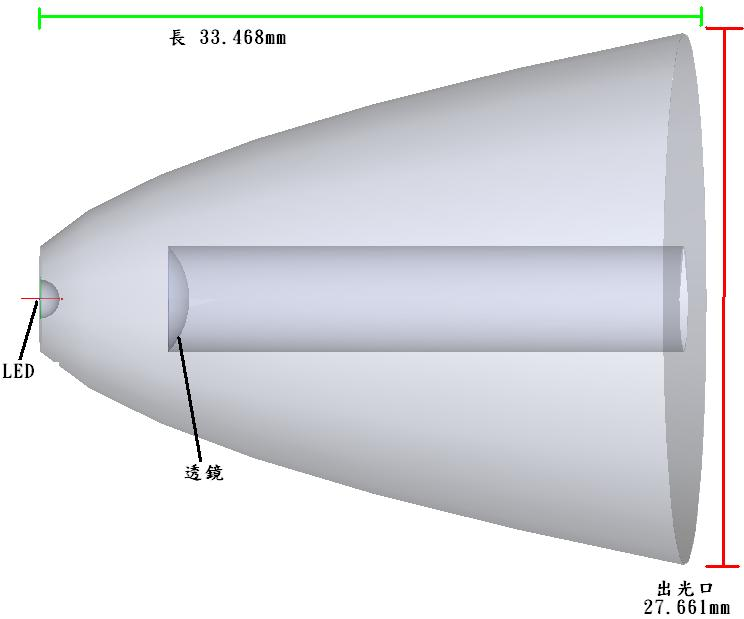
Figure 7. TIR Module Diagram
Figure 8 (Ray Tracing Diagram for 100 Rays) shows that 90-degree divergent rays exit parallel through the outer parabolic reflector and the front lens.
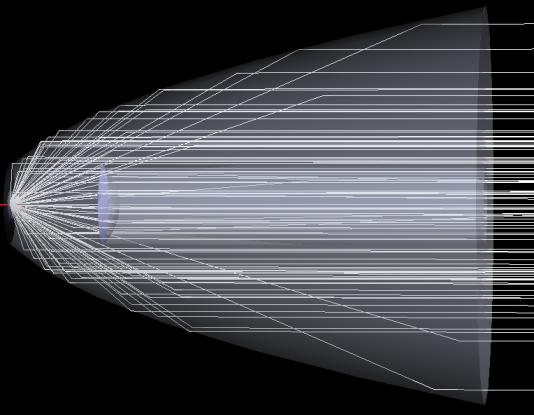
Figure 8. Ray Tracing Diagram for TIR Lens (100 Rays)
The illuminance diagram (Figure 9) from the 50,000-ray simulation shows that high-intensity light (red) is also concentrated in the center, with the same intensity range (0.0136~0.0153W/mm²). The intensity decreases through orange (0.0119~0.0136W/mm²), yellow (0.0102~0.0119W/mm²), light green to green (0.0051~0.0102W/mm²), and light blue (0.0017~0.0051W/mm²), forming a circular pattern. However, the light outside the center is less uniform.
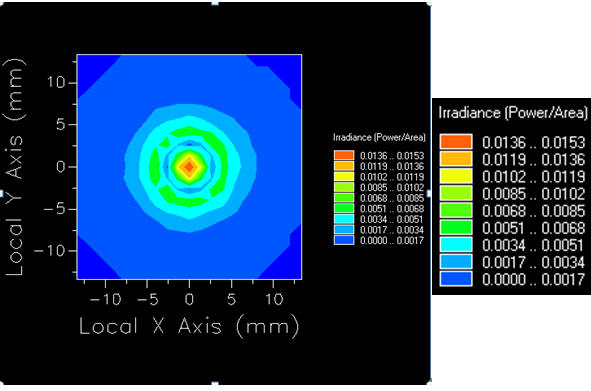
Figure 9. TIR Lens Illuminance Diagram
Figure 10 (TIR Lens Light Spot Diagram) shows that the central light forms a concentrated circle, while the peripheral light is weaker.
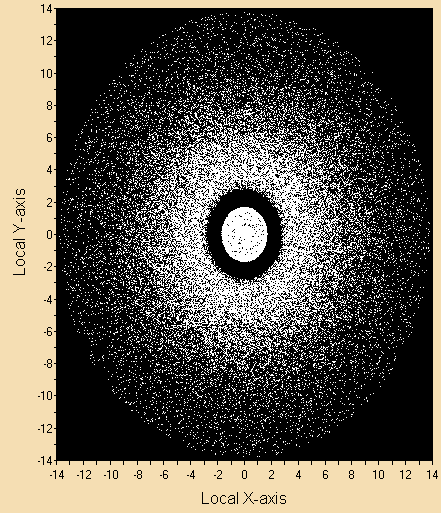
Figure 10. TIR Lens Light Spot Diagram
A comparison of the illuminance diagrams (Figure 11) reveals that both have the same light intensity, but the proposed module (left) has more concentrated and uniform illuminance than the traditional TIR lens.
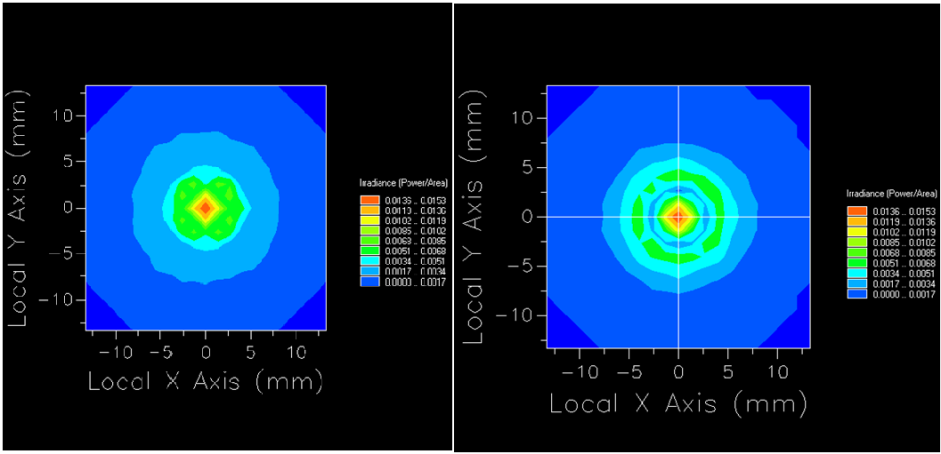
Figure 11. Comparison of Illuminance Diagrams
Figure 12 (Comparison of Light Spot Diagrams) shows that the left diagram (proposed module) has stronger central light with visible patterns from the three parabolic reflectors, while the right diagram (TIR lens) has weaker peripheral light.
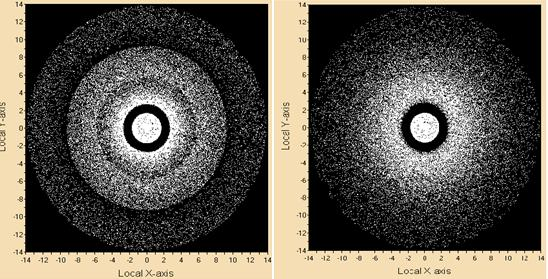
Figure 12. Comparison of Light Spot Diagrams
Figure 13 (Comparison of Module Sizes) shows that both modules have the same light outlet and lens sizes and positions, but the length of the proposed module (left) is 19.632mm shorter than the TIR module (right).
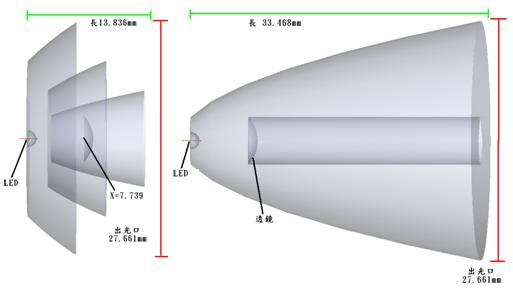
Figure 13. Comparison of Module Sizes
2. Conclusion
The multi-parabolic reflector luminaire designed in this study is smaller in volume than the TIR lens, thus reducing the space occupied by the luminaire. Despite its smaller size, the illuminance is more concentrated and uniform than that of the TIR lens. It can be applied in flashlights, indoor/outdoor lighting, spotlights, and LED vehicle lights.