Design and Evaluation of an LED-based Light Fixture
1. ILLUMINATION SYSTEM GEOMETRY
The first challenge is to couple the light from the LED into the light guide with minimum light loss. Higher coupling efficiencies can be achieved by matching the numerical aperture or the light acceptance cone of the light guide to the light emission cone of the LED. In this case, the coupling efficiency is greater than 92%. The 8% loss is due to Fresnel reflection at the air gap on either side. One way to minimize the Fresnel loss is to locate the LED inside the envelope of the light guide as shown in Figure 1 and fuse the two materials (the epoxy dome of the LED and the light guide), or to use index matched epoxies. Therefore, in this study all the light guides have concave cavities to locate the LEDs inside.
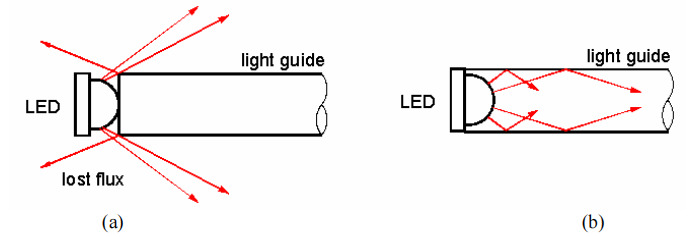
Figure 1: (a) LED external to a light guide; (b) LED located inside a light guide.
The LEDs used in this study have much larger cone angles for the LED emission (80 half angle). As a result, light that is emitted at angles greater than 30° will escape from the light guide without undergoing TIR.
The rest of the coupled light then propagates inside the light guide and eventually leaves the light guide. Different surface treatments of the light guide can change the propagation of light. We know that light can be controlled in a number of ways: reflection (diffused and specular), transmission, and refraction. Thus, two features are critical for a light guide to provide a certain candlepower distribution: surface property and section shape. If surfaces are perfectly polished, rays coupled into a light guide travel through by reflecting back and forth (TIR) among the outer surfaces (Figure 2a). But if one surface is changed into a lambertian scattering surface, the incident light undergoes diffuse-scattering, and most of this light is refracted from the opposite surface (Figure 2b). The lambertian surface can be created with a layer of diffuse white paint. Moreover, the shape and dimensions of the light guide, as well as the microstructure array on the surface, also contribute to the light distribution of the light guide.3, 4 Usually, it is easier to manufacture light guides with square, rectangular, or circular cross sections.
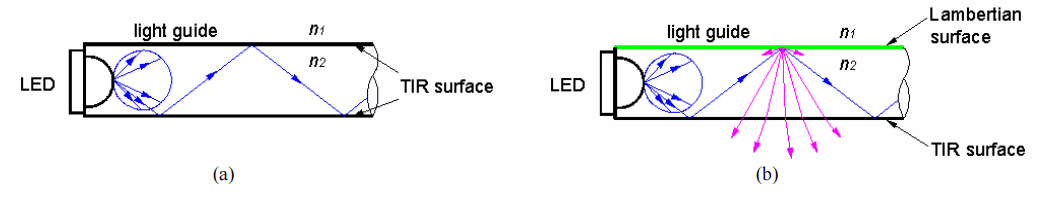
Figure 2: (a) a perfectly polished light guide; (b) a light guide with a lambertian scattering surface.
2. MODELING
2.1 Light source modeling
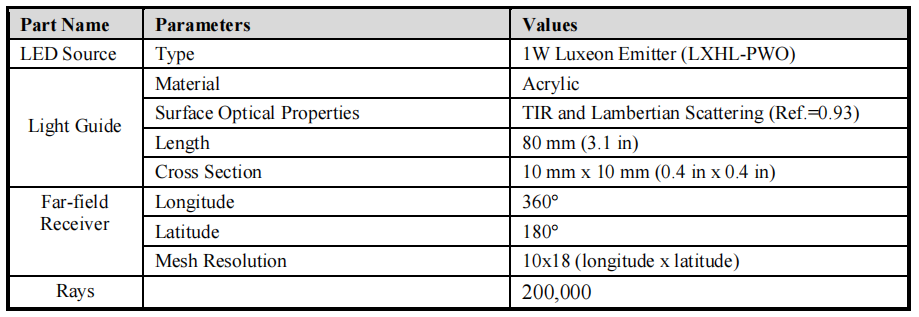
The first step was to model the light source. The specific LED source used in the computer simulation is a commerciall available product, the Luxeon emitter (LXHL-PWO). As a high-power LED, the 1-watt Luxeon white emitter can
provide flux as high as 18 lumens. The light source model was created in LightTools. Figure 3 shows the LED source model and its lambertian candlepower distribution, which match the specification from the manufacturer.
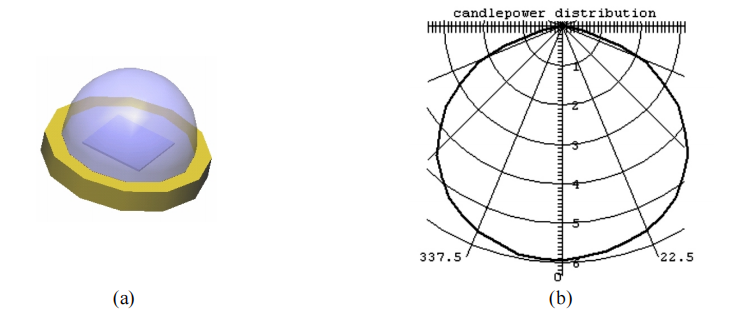
Figure 3: (a) Simulated Luxeon Emitter LXHL-PWO; (b) Candlepower distribution of the LED model.
2.2 Light guide modeling
The next step was to model the light guides. The light guides should provide three basic candlepower distributions: cosine downward, batwing downward, and batwing upward. As stated earlier, cosine will produce the directional accent light on the table in a conference room, and the batwing will provide the uniform illuminance on the ceiling, the walls, and the floor. Moreover, one of the main requirements for a fixture is to maximize the amount of light coming out of the fixture. Therefore, the optical efficiency of the light guide is defined by:

Where Φin is the flux emitted by the LEDs, and Φout is the flux exiting from the light guide and reaching the far-field receiver. Light losses are caused by absorption inside the light guide material and by trapped inside the light guide. Therefore, the goal was to maximize the amount of rays reaching the far-field receiver. The far-field receivers recorded the flux and the direction of the incident rays. The data at the detector was used to optimize the system design.
The light guide modeling began with a scaled-down version to quickly determine the optimum parameters that can provide the ideal distributions and higher efficiency. Finally, a full-size fixture was modeled based on the analyzed parameters.
2.2.1 Cosine distribution
As discussed previously, the direction of propagation of the rays inside the light guide can be modified by the shape of the cross section. The rectangular-shaped light guide was selected for this study. All surfaces, except for two, were made lambertian (93% reflectance); the concave surface where the LED was placed and the end surface where light exited were made TIR surfaces, as illustrated in Figure 4. With this surface treatment, rays exiting the TIR surface formed a cosine candlepower distribution across the light guide (0o direction). Figure 5a illustrates the ray tracing results. Table 1 shows the physical model parameters of the scaled light guide. The result shows that this scaled light guide has an efficiency of 64%. The light loss came from the lambertian surface absorption (34%). It was observed that the efficiency was dependent on the dimension of the light guide. Normally, the larger area of the TIR surface, the higher the efficiency.
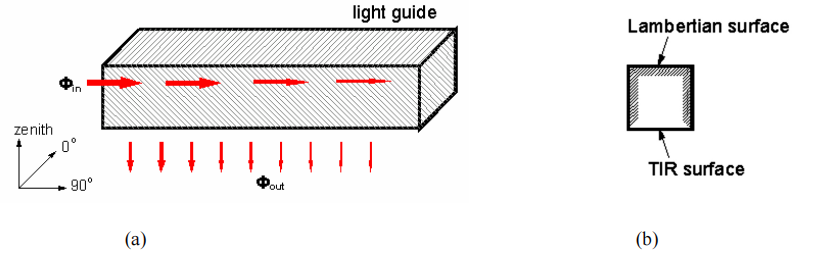
Figure 4: (a) Isometric view and (b) cross section view of the surface property of the light guide to achieve a cosine distribution at 0 .
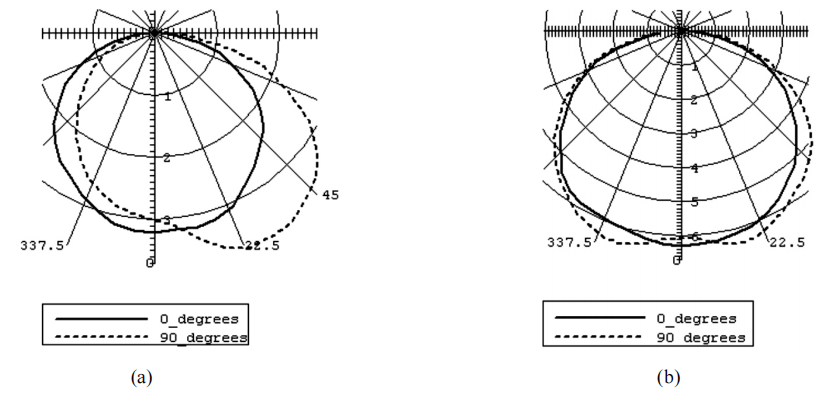
Figure 5: The candlepower distributions at 0 and 90 degree (a) with only one LED and (b) one LED at both ends.
Table 1: The light guide physical model parameters in LightTools.
It was noticed that the distribution in one 90 direction (along the axis of the light guide) was quite asymmetric; more rays were coupled out near the source end. This problem was solved by adding one more LED at the opposite end, thereby allowing both directions (0o and 90o) to have cosine distributions (Figure 5b).
2.2.2 Batwing distribution
Currently, there is no definition for batwing distributions that quantifies the amount of light in each zonal angle. In this study, we defined a batwing distribution as having a maximum luminous intensity around the 45 zenith/nadir angle, with less than 70% of the maximum luminous intensity at the zenith/nadir angle, as shown in Figure 6. To achieve such a specific distribution, the surface finish of the light-exiting surface must be modified. A previous study shows that a prism light guide can exhibit a large range of photometric characteristics. Using this concept, the micro-prism array was used in this study as the surface treatment in order to produce the batwing distributions. The following procedure was used to create the batwing distribution.
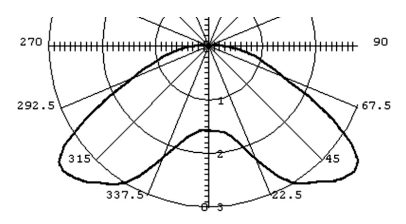
Figure 6: A batwing distribution.
In this study, a symmetrical distribution along the fixture (0 degree direction) was desired. Therefore, a batwing distribution could be achieved by combining two identical light guides. Both had a maximum intensity at the 45 degree zenith/nadir angle, as illustrated by Figure 7.
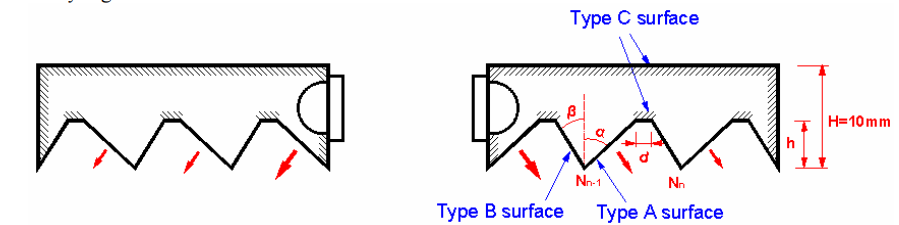
Figure 7: The cross sections of the scaled light guides for batwing distribution and their design parameters.
The prism shape influences the efficiency and the direction of propagation of the output rays. The parameters adjusted in this study are listed below:
• α: angle of the type A surfaces, where light exits the light guides.
• β: angle of the type B surfaces, where light reflects inside the light guides.
• h: height of the prism.
• H: light guide thickness, limited to 10 mm.
• d: distance between two neighboring prisms. (This study didn’t consider the linear offset distance.)
• N: number of prisms.
• Surface property: TIR for type A surface; TIR 100% reflectance for type B surfaces; lambertian scattering (93% reflectance) for type C surfaces.
All these parameters determine the amount of output rays. Moreover, the orientation of the type A surface (α) is critical to the direction of the output rays and therefore, the candlepower distribution. Therefore, a pilot study using a scaled-down version of the light guide was conducted to determine the optimum design of the micro-prism array in terms of the light distribution and the efficiency. Each parameter was varied while holding the others constant. The output beam was analyzed for distribution and efficiency.
2.2.2.1 α value to achieve the batwing distribution
Analysis began with the variable α. The remaining parameters were held constant: β=45degree , h=2 mm, d=4 mm, and N=8. Table 2 shows the physical model parameters of the light guides in LightTools. Only one LED was located inside each light guide, and two light guides were in mirror position, similar to the cross section shown in Figure 7. The separation between the two light guides was 10 mm.
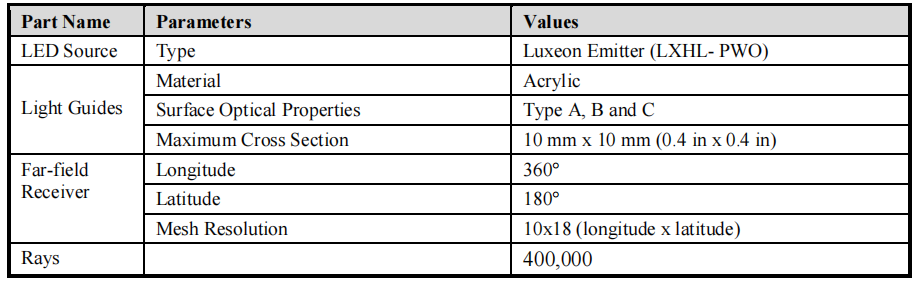
Table 2: The physical model parameters of the light guides in LightTools.
Table 3 shows the results of the ray-tracing analysis. It is interesting to note that when α increases, efficiency increases because a larger TIR surface allows more rays to exit. However, the candlepower distribution becomes closer to a cosine. Hence, there is a trade-off between the efficiency and the distribution. Therefore, 20 was selected as the optimum angle for type A surfaces.
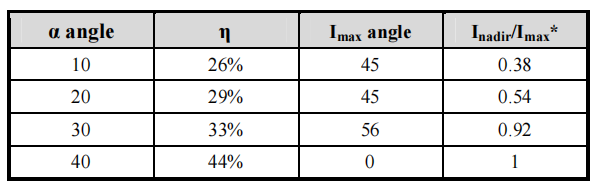
*Imax: maximum luminous intensity along the light guide (0o); Inadir: luminous intensity at the nadir angle.
Table 3: Simulation results to achieve the batwing distribution.
2.2.2.2 β, h and d combinations to increase the light guide efficiency
The next series of ray-tracings were simulated to identify the optimum β value. The α value obtained from the previous tests was used, 20 . Again, the remaining parameters, h, d and N, were kept the same as for the previously described condition. The parameters for the model in LightTools were kept the same as those in Table 2. Figure 8 shows the change of efficiency η as a function of β. Similarly, efficiency increases when β increases. However, a slight change of the light distribution was observed. Again, 40o was identified as the optimum value for β, with a trade-off between the distribution and the efficiency.
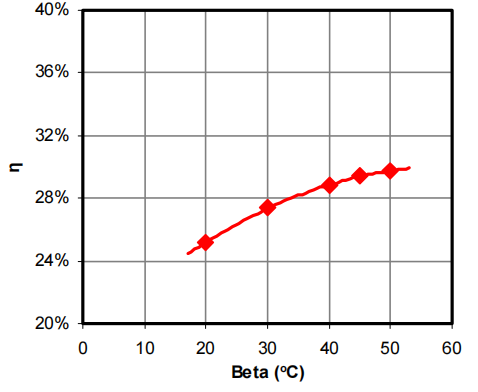
Figure 8: The efficiency of the light guides as a function of beta angle.
Then, at the condition of α=20 , β = 40 , d=4 mm, and N=8, the relationship between the height of the prism and the efficiency of the light guide was analyzed. The results are shown in Figure 9. When h increased, the efficiency increased up to a certain point. However, the efficiency dropped depending on the thickness of the light guide. Therefore, taking into account the size of the LED and the thickness of the light guide, the optimum height of the prism was determined to be 3.5 mm
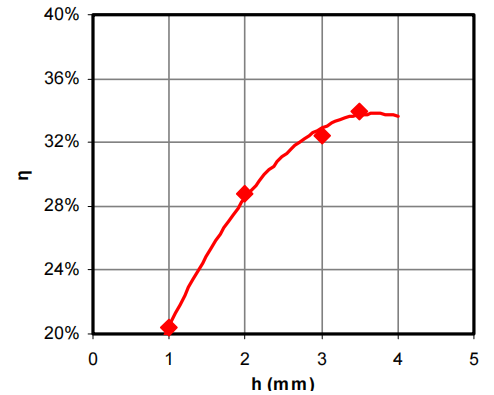
Figure 9: The efficiency of the light guides as a function of prism height.
The last step was to decide the suitable density of the micro-prism, i.e. the distance d between two neighboring prisms. For this analysis, the other parameters were kept as: α=20 , β = 40 , and h=3.5 mm. Also, the length of the light guide was kept at 60 mm, instead of a constant number of prisms. As shown in Figure 10, the efficiency dropped when the distance between two neighboring prisms decreased, but the distribution was closer to resembling a batwing. By making a trade-off between the efficiency and the distribution, a distance of 2 mm between two neighboring prisms was considered to be the best.
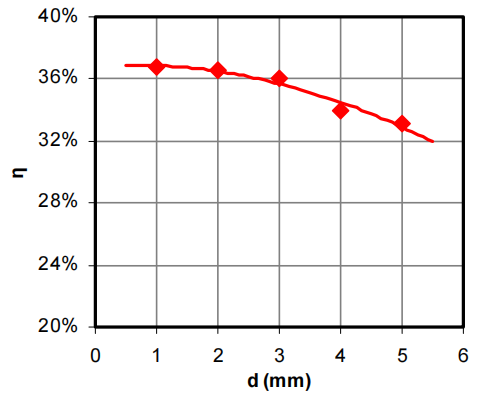
Figure 10: The efficiency of the light guides as a function of distance between prisms.
Optical ray-tracing analysis shows that to achieve the batwing distribution and maximize the light output efficiency, the optimum values for parameters α, β, h and d should be 20 , 40 , 3.5 mm and 2 mm, respectively. The authors of this manuscript wish to point out that the values determined for the different parameters are specific to the fixture design addressed in this study.
2.3 Final system design
The final task was to scale up the models and integrate the different subassemblies to form a light fixture that can provide the necessary light distribution and light levels for the target application. In order to illustrate the design concept, the most common dimension of an indirect-direct fluorescent lamp fixture was chosen: the length of the light guides at 1200 mm (4 feet), and the total width at 300 mm (1 foot). The system’s cross section view is illustrated in Figure 10. Light guide A provided a cosine downward distribution. Two light guides B and two light guides C provided the distributions of batwing down and batwing up, respectively. Light guide B and light guide C were attached to form a single element. The light guides had the same dimensions: 1200 mm in length, 80 mm in width, and 10 mm in height. The dimensions for the micro-prism array followed the results obtained in the earlier analysis. The LEDs were located inside the light guides. Only light guide A had LED arrays located on both sides along the length (0 direction). Light guides B and C each had one LED array on one side along the length of the light guide. (See Figure 11) The number of LEDs used for light guide C was two-thirds of light guide B because less light was needed for the upward light than for the downward light. Considering the heat dissipation requirements for the Luxeon emitters, the LEDs were set 25 mm apart for light guides A and B, and 37.5 mm apart for light guides C. Therefore, light guides A, B, and C had 96, 48, and 32 LEDs, respectively. Moreover, these LEDs were designed to be mounted on aluminum, which also performs as a heat sink. In a real-life fixture, the heat sinks would be extruded with fins, which could increase the exposed surface area for convection. The space between the light guides was designed for the aluminum connection. Appendix A shows the detailed dimensions of the whole fixture.
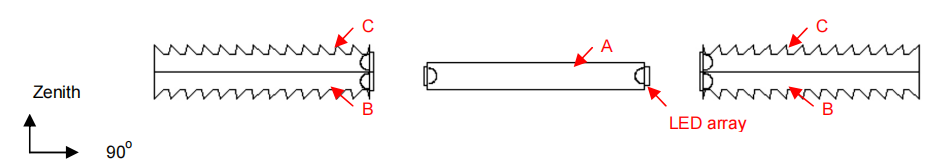
Figure 11: Cross section view of the light guide system.
Two steps of ray-tracing were conducted. First, the distributions of the light guides were tested with a far-field receiver. Also, the efficiency of the light guides was calculated in the first step. The second ray-tracing mimicked conditions using this light guide system in a 5x5x3.3-meter (15x15x10-foot) conference room, with one 1.3x2-meter (4x6-foot) table in the middle of the room. Then, the illuminance distribution on each surface was simulated. According to the IES Handbook, the illuminance level on the table for a conference room should be 500lx, and the illuminance uniformity (defined as the maximum to average ratio) on the table, the walls, and the ceiling should be less than 10, 10, and 3, respectively.
3. SIMULATION RESULTS
Figure 12 illustrates the candlepower distributions from each part of the light fixture. They conform to the previous requirements. As seen in these figures, LEDs along with light guides can provide almost any beam distribution. The efficiency for the light guides of cosine distribution, batwing distribution, and the whole system are 81%, 40%, and 55%, respectively. This type of fixture efficiency is quite low for practical use. For the cosine distribution, 19% of the input light is absorbed by the light guide. As for the batwing distributions, around 50% of the input light is trapped inside the light guides, not including a 8% and a 5% light loss caused by absorption and Fresnel loss, respectively. Apparently, more light loss occurs inside the light guides providing the batwing distribution compared with cosine distribution.
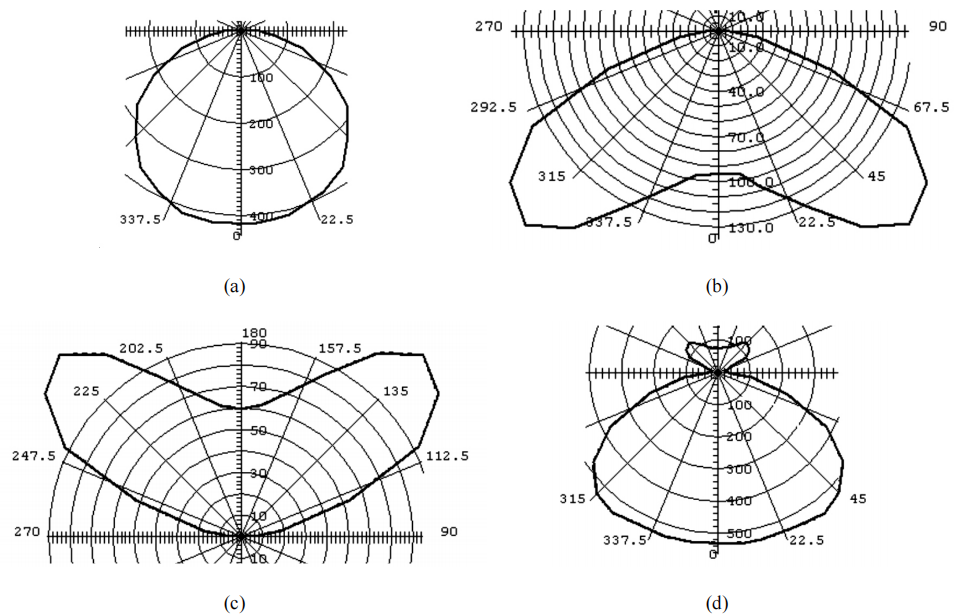
Figure 12: (a). Cosine distribution from light guide A; (b) Batwing downward distribution from light guides B; (c) Batwing upward distribution from light guides C; (d) The whole distribution when all the LEDs are switched on.
Figure 13 shows the illuminance distributions on the table, front walls, sidewalls, and ceiling, respectively, when all LED arrays were switched on. The x and y axes correspond to the physical dimensions of these surfaces. The illuminances on these surfaces are given in the colorscale values. Table 4 gives the maximum illuminance, the average output illuminance, and the uniformity ratio on each surface. The uniformity on all surfaces is very good, especially on the table, close to 1:1. However, the light level on the table is low because of the low efficiency of the light guides providing the batwing distribution.
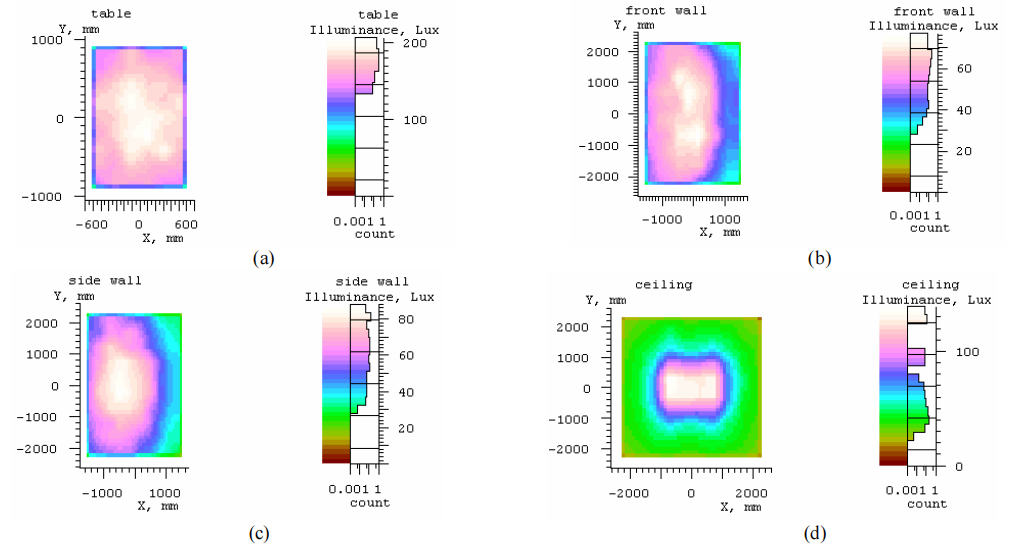
Figure 13: The illuminance distributions on the (a) table, (b) front wall, (c) side wall, and (d) ceiling.
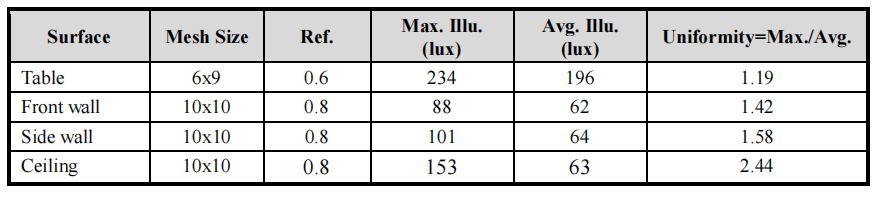
Table 4: The maximum and average illuminances on the surfaces and the uniformity ratios.
4. DISCUSSION
Conference room light fixtures using an LED light guide system were explored through computer modeling. While a rectangular-shaped light guide with simple diffused reflective surfaces provided the necessary cosine beam distribution, a more sophisticated surface treatment was required on the light extracting surface of the light guide to create the batwing beam distributions. The surface finish structures were in the form of micro-prism arrays. By switching LED arrays on and off to different light guides, various light levels and distributions could be achieved for different occasions. Further analysis showed that, when used in a typical conference room set up the fixture produced acceptable uniformity over the surfaces. Although the system provided the necessary beam distributions, the system efficiency was quite low, only 55%. The highest light loss occurred in creating the batwing distribution. The overall system efficiency must be greater than 80% for this type of a fixture to become a viable solution.